Google Search

Custom Search

Thursday 18 March 2010

Politics and slowly emerging from the dead

I took a brief break from trading after my call on the beginning of the double dip proved to be wrong. That is not to say that I do not believe that the double dip will happen - I am still convinced that this will happen, especially in the UK. I refer readers to read my article in GX Magazine for more details.

I closed my short ESM0 positions at a decent profit of £570, but if I had closed at the bottom I could have realised £870. Luckily I employed a trailing stop. The reason I held the trade for so long following the bounce was that I had intended to keep the position open for the long run if the ‘W’ shape were to be fulfilled. This was not the case, and even though I could have made more money by closing the position when it was in profit, I stuck to my initial conviction. Put it this way, if I had closed near to the bottom, but the market fell even further confirming my initial view, I would be kicking myself even harder than I am now! But that’s the name of the game; you have to take risks to make the big bucks!

I have been watching news of the election in the UK unfold and the sentiment seems to be that we may be heading for a hung parliament (where no one party has an overall majority). This would be terrible news for the pound. I have taken a couple of short sterling trades based on technicals. I will post the graphs another time.

I am in favour of a change in government and that means that I am supporting the Tories, but that is mainly because they are the best of a bad bunch! The fact that they plan to tackle the UK's deficit as soon as possible is a positive step and I think that a continuation of the Labour government would be bad news for the British economy and our credit rating.

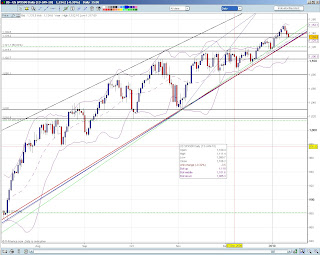
I have also taken a couple of short term short positions on the S&P (ESMO - June contract) and the FTSE (Z HO) again based of the technicals - you can see the graphs below.

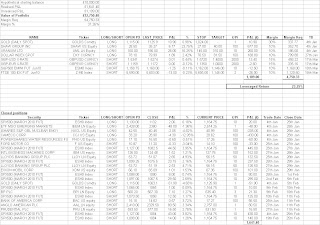
The portfolio is perfoming steadily with a 20.8% return over the initial investment.


Thursday 25 February 2010

Update....

It's been a couple of weeks since my update - mainly due to being uber busy at work! The market bounced following the recent drop following the break of the long term diagional support. This rally seems to be over now the recent support has broke. The graph below is showing a head and shoulders formation where the neckline has broke down. These are all bearish singnals. I cut my shorts at a pretty good time and I am going to look into load the book once more. I took another S&P Future short on the 16th Feb at 1,098. I could have picked a better entry if I waited a bit longer for the graph to touch the upper resistance once more.

Regardless, the 61.8% Fib level has not been sucessfully penetrated and the resistance at 1,114 looks strong. I see the 1,066 as the next support level, a break of which should see the price action return to the low at 1040.


Thursday 11 February 2010

Cutting shorts....

Quick note - I have cut my single name shorts as I have lost some of my conviction on the downswing as we have failed to make new lows. I am still bearish, but thought it best to lower my risk and wait for a clearer picture to emerge.

Interestingly, it looks like I should have kept the the long BP trade off the support that I cut yesterday - another case where I cut to early. I should have had more conviction in the trade given the strong technicals.

Wednesday 10 February 2010

An indication that rates may rise....

Today, Ben Bernanke publically announced that the FED may raise the discount rate in the US "before long," but repeated the Federal Open Market Committee statement that low rates are warranted "for an extended period."

How ambiguous is that?! What ever the reason behind the announcement, the fact is that this is bad news for equities and furthermore adds more uncertainty to the current market climate. Higher rates are likely to encourage people to put money in savings which means less spending (lower consumption) and consequently, lower profits and less incentive to invest (why invest in risky stocks if you can get the same returns in a "safer" savings account). The S&P fell sharpy on the news.

This is good news for my net short portfolio. This morning the ESH0 (S&P March Future) rallied up to 1,072 on the back of news out of Germany and the EU suggesting that they would support a possible bail out. On the back of this, I added to my shorts at resistance, getting in at 1,070.5. This gave the portfolio heavy exposure to the downside (3 short S&P positions open), so I closed the short opened yesterday at a small 1pt profit on the diagonal support @ 1,065 (since been broken). I also took the opportunity to close the BP long position (short hedge) which is likely to be impacted by the possibility of falling oil prices should the fall in equities continue.

Tuesday 9 February 2010

Sideways movement....but where next??

At the end of last week, I mentioned that I would be looking to re-enter shorts at 1,066 on the March Future - I have taken this position today. However, the market looks to be trading sideways, without any significant indication that the trend will be continuing in any one direction.

In light of this, using the spreadsheet tool I have built, I was looking for a technically strong long position as a short term hedge. BP Plc (BP/ LN Equity) is sitting on a good diagonal support formed since March last year and have taken a small long position with a tight stop.

On the S&P500, the price action has been contained within a downwards channel (daily graph) with the next key support at 1,040 (cash index).


I have attached my latest graphs below with a brief comment on each - feel free to contact me with any questns or comments.

AAL LN - diagonal support broken on downside. Price contained in down channel. Shorts good unless diagonal support is broken on the upside and/or resistance of channel broken on upside. 

BAC US - diagonal support broken on downside. Break out from converging triangle validates shorts. Looking for horizontal support to break for continuation on downward price action. 

BP/ LN - big support holding thus far. Favour long positions as long as this is the case. Resistance (previous high) to be broken to further validate long positions.

DXY - down channel broken on up side. Trading within an upwards channel off low. Inversley correlated to the S&P.


S&P500 - 2hr graph (March future): noise at the previous low. Price action contained by downwards channel. Continuous lower lows achieved validating bearish view.
Daily cash index graph: diagonal support broken on down side and trading within a channel. Trading just above a key support zone.

PRU LN - diagonal support broken on downside. Shorts good unless diagonal support is broken on the upside and/or resistance of channel broken on upside. Next support zone joins recent low and a previous resistance.

Friday 5 February 2010

End of another sucessful week...

The markets continued to fall as I expected this week - unfortunately I was a bit conservative in closing my single name shorts early, especially Lloyds which could have banked me another 140 points!

Nevertheless, the portfolio is performing well with the current value over £12k.

I closed the most recent S&P short opened @ 1,097 when it looked like we hit a support @ 1,067. Again, this was premature as the S&P dismissed this technical level and powered through, reaching a low of 1,050.5. I still have my long term short from 1,127 open with the 'double dip' in mind hoping that the high may be in for the time being.

From a shorter term prospective, I am looking for a retrace back towards 1,066 to sell short once more.

Levels to watch:
Support: 1,059 and 1,050 (March Fut); 1,039 (cash index)
Resistance: 1,065 and 1,078 (March Fut)

On the cash index, the 1,070 level looks key to me - it has acted as both a support and resistance level in the past. A breach above this level will mean re-evaluating my bearish view.

The long dollar trade is looking better everyday as it continues to power through the diagonal resistance. From a fundamental and macro point of view the trade is looking like a good long term bet.

I also cut half of the gold position - I was very bullish gold coming into this year, however the sentiment I am getting from the market is that the rally may have been a mini bubble which is always liable to burst. Since I lost some of my conviction, I closed half at a small but significant loss, keeping open a small position while keeping a close eye on my stop at 1,024.

Have a good weekend all!


Thursday 4 February 2010

Range trading on the back of some bad news...

The S&P rallied in the early part of this week, mainly on the back of good GDP news at the end of last week. However, a mixed bag of news surrounding jobless claims in the US, concern governments will struggle to fund their budget deficits in Europe, strikes in Greece promted by spending cuts and the BoE deciding against further quantitive easing has caused the market to drop sharply today.

Worth noting that both the BoE and the ECB have held rates at 0.5% and 1.0% respectively.

The BoE decision in relation to QE looks to be driven by inflationary concerns. This may put upwards pressure on interest rates. However, the ECB and the FED have signalled the intention of keeping rates at their current levels for an extended period. In the UK growth was lower than expected at 0.1% which is leading many analysts to expect that rates will remain low to avoid falling back into recession.

All good news for my portfolio which is net short. I had cut my S&P short on Monday @ 1080 following the rally. I since opened another short close to the top of the range @ 1097 which is looking healthy. I am sitting on the BAC, AAL and PRU positions. The Dollar trade is also looking good especially on the back of the jobless claims news out of the US. All in all, I am still bearish.


Friday 29 January 2010

Good GDP news out of the US

GDP data out of the US today was better than expected with QoQ annualised return hitting 5.7%. Personal consumption was also slightly better than expected. The S&P reacted as would be expected,  ralling from today's low of 1,070 (March Fut) back up to 1,090. I took the opportunity to close out the rest if the Lloyds position (+253 points) and the Exxon short (+101 points) and also added to my short S&P position at 1,088.

I am still bearish - the index is making lower lows while failing to breach the upper level of the range.
Key levels to keep an eye on (March Fut):
- Resistance: 1,090 ; 1,103 - a break above 1,103 would lead to re-evaluating shorts
- Support: 1,080 ; 1,071 (today's low) ; 1,066

Thursday 28 January 2010

Profit taking...

The S&P pretty much did exactly what I was expecting today - we saw a retrace back up to the resistance at 1,103 on the March Future (1,107 on the cash index) and a subsequent fall. I used the retrace to add to my short S&P position. I am expecting it to return to the recent lows around 1080 (March fut). The employment news out of the US today was not great which adds to my bearish bias. US GDP data is out tomorrow and some big firms are scheduled to release results over the next week (including Microsoft and Amazon) which should give an indication to the price action we can expect in the short term.


I also took closed the IBM trade at a nice profit (+152 points) and closed half of the Lloyds position (+265 points) to lock in some realised profit.


Wednesday 27 January 2010

A little note on the S&P...

Just had a close look at the S&P cash index - following what I was saying below about the fact that it may be trading in a range, today's double bounce off the support @ 1,085 may be a sigificant signal to suggest that we may see a retrace of the fall back up to the 1,100 level. Something that is worth keeping an eye on.


Downside favoured...add to shorts!

Quick update - the S&P has continued to fall on the uncertaintly surrounding banking reform. The index has fallen 4.69% since breaking it's diagonal support.

This obviously has implications on single names. I have used a tool I have built to identify stock where they may be the technicals to take advantage of the drop. My tool threw out Anglo American, Prudential, Exxon Mobil and IBM as good technical shorts should the fall continue. This is in addition to the Lloyds and Bank of America shorts I added previously. It makes sense that financial and oil related stocks are the first to be hit.

Short term it looks like the S&P is trading in a range between 1,100 and 1,081 (March 2010 future). For this reason, I cut half my short S&P. I also lost conviction on the Ford position and closed it at a small loss. I will look to a break above 1,100 reassess my shorts. In the meantime, I will be looking for a break of 1,081 to add to my shorts while keeping a close eye on the the single name charts for support areas to close my positions.

I have changed the structure of the portfolio table to make it easier to follow. I have added a hypothetical account balance of £10,000 and you can track the performance by looking at the current value of the portfolio on the top left of the caption. It is also easier to assess the margin requirements of putting on similar positions with most online brokers.


Monday 25 January 2010

S&P broke down - start of a new bear?

Following Mr.Obama's comments on banking reform on Thursday, the S&P conculsively broke it's long term support on the downside. This prompted me to stop and reverse my long S&P position. As you can see below, the size of my short is double that of the long position I had previously - this is because my conviction for trading the break of the support was very strong.

The apparent reversal in the market also caused some of my longs to get stopped out - namely Cameco Corp and the Powershares Water Fund. From this I decided to reduce the risk of the portfolio and close the EM ETF and the iShares Energy Fund. The reason is that the portfolio feels overweighted on the long side considering this may be the start of a wave down.

I have opened short positions in Lloyds, Bank of America and Ford to hopefully capture some of the move down. You can see the details below - I will follow up with graphs in due course.


Monday 18 January 2010

S&P level tested and held....so far!

The diagonal support on the S&P (March 2010 future) looks to have held for the time being - although it is Martin Luther King day in the US and the equity markets aren't open (futures are trading). I am expecting a continuation of the bounce tomorrow with mining leading the way - which should be some much needed good news for Cameco.

American banks will be in the headlines this week, with earnings reports from Citigroup (Tues), Bank of America, Morgan Stanley, Wells Fargo (Wed), Goldman Sachs, American Express and ICICI (Thurs). General Electric are reporting on Friday and IBM's results on Tuesday should give an indication about US business spending. Trading updates from the US airlines Continental and Southwest will come in on Thursday.


Friday 15 January 2010

S&P Update - Back on support and looking weak

Quick note - the S&P is right on it's support, despite the good financial results out today. We may see a continuation of the correction at the beginning of next week. Keep a close eye on the cash breaking 1,130 and the March Future breaking 1,127 - if it does I will look at stopping and reversing the long position and also re-evaluate the Emerging Markets ETF and the iShares S&P GBL Nuclear Energy positions.

Have a good weekend all!


Cameco Corp looking weak

Cameco Corp is dropping towards it's stop at 30 - I have decided to move my stop 29, just below the medium term support. The reason for this is because I view the position as a long term trade. What I don't want to happen is to get stopped out when the long term support is broken then seeing the medium term support hold and the price bounces back up past the long term support.


Also, see the latest performance of my portfolio below. The average was as high as 4.5% during this week, but today's drop in the equity markets has wiped off some of those gains. The retail and jobless claims data out of the US was pretty bad. The S&P is back testing it's long term support - again I am expecting the level to hold. However the end to this week and the beginning of next should give a clearer indication to the short term direction of the market. Keep an open mind!!


Thursday 14 January 2010

S&P Support Holds - portfolio update

The S&P bounced off it's support in style yesterday which is good news for all the bulls out there. From a technical perspective, this weeks candle formation is all important - at the moment it is showing a 'doji' which conveys a sense of indecision between buyers and sellers. It could be that the the buying pressure is starting to weaken. Obviously, we have to wait until the candle is fully formed to infer anything, but it is worth noting that the candle may signal the start of a reversal.


The latest performance of my portfolio is below - I have included hypothetical 'bets' for those looking at the leveraged spreadbetting option. As you can see, using leverage significantly increases the percentage returns as determined by the margin required to put the positions on.

Note - the £100/pt shown for equities is the same as £1/pt where the tick size is x100 (as offered by most spread betting brokers). For example, Shaw Group trading @ 3240 (32.40 x 100), long £1/pt.

Wednesday 13 January 2010

S&P - Big break??

For those who are interested, the S&P is hovering around it's long term diagonal support on the weekly and daily chart (formed since the March 2009 low). A break of this line may be a key signal so I am keeping a very close eye. As you can see, I am currently long the S&P in my virtual portfolio. Tomorrow's retail sales data and inflation data on Thursday could be key. See below for graphs...


A New Beginning....

As you may have noticed, it's coming up to a year since I last updated my blog! March 2009 was a very busy time for me career wise, so I ended up sacrificing my blogging duties so I could have a life. Now thing's have calmed down a bit and I have had some good news!

I am going to be writing monthly articles for GX Magazine on my views on the economy and investment ideas. The articles are going to be supplemented by entries on my blog - readers can follow my latest thoughts, check my graphs and follow the performance of my virtual portfolio.

My first article is appearing in February's edition so I cannot go into too much information on here before it is published.

I thought I'd share my virtual portfolio in the meantime - I have selected the following positions based on my views on how I believe the economy is going to perform in the year ahead and beyond. Short(ish) term I am bullish the equity markets (US and emerging markets), medium to long term I am bullish the nuclear sector and gold. I have also gone for a defensive play with a water fund. Should my views change, I will update on here. You can see the performance below - I will be monitoring the positions daily and once the article is published, I will upload the charts. Click on the below table to open in a new window.


The opening prices are from the 4th January when I started writing the article. They are securities that I have been watching for months and ones I believe are worth looking at for good growth potential.
The average performance can be used as an indicator for the performance of a portfolio made up of an equally value weighted portfolio of the securities on the table.

Please feel free to contact me if you have any questions or comments!